
How to Turn Ad Data Into Better Campaign Decisions
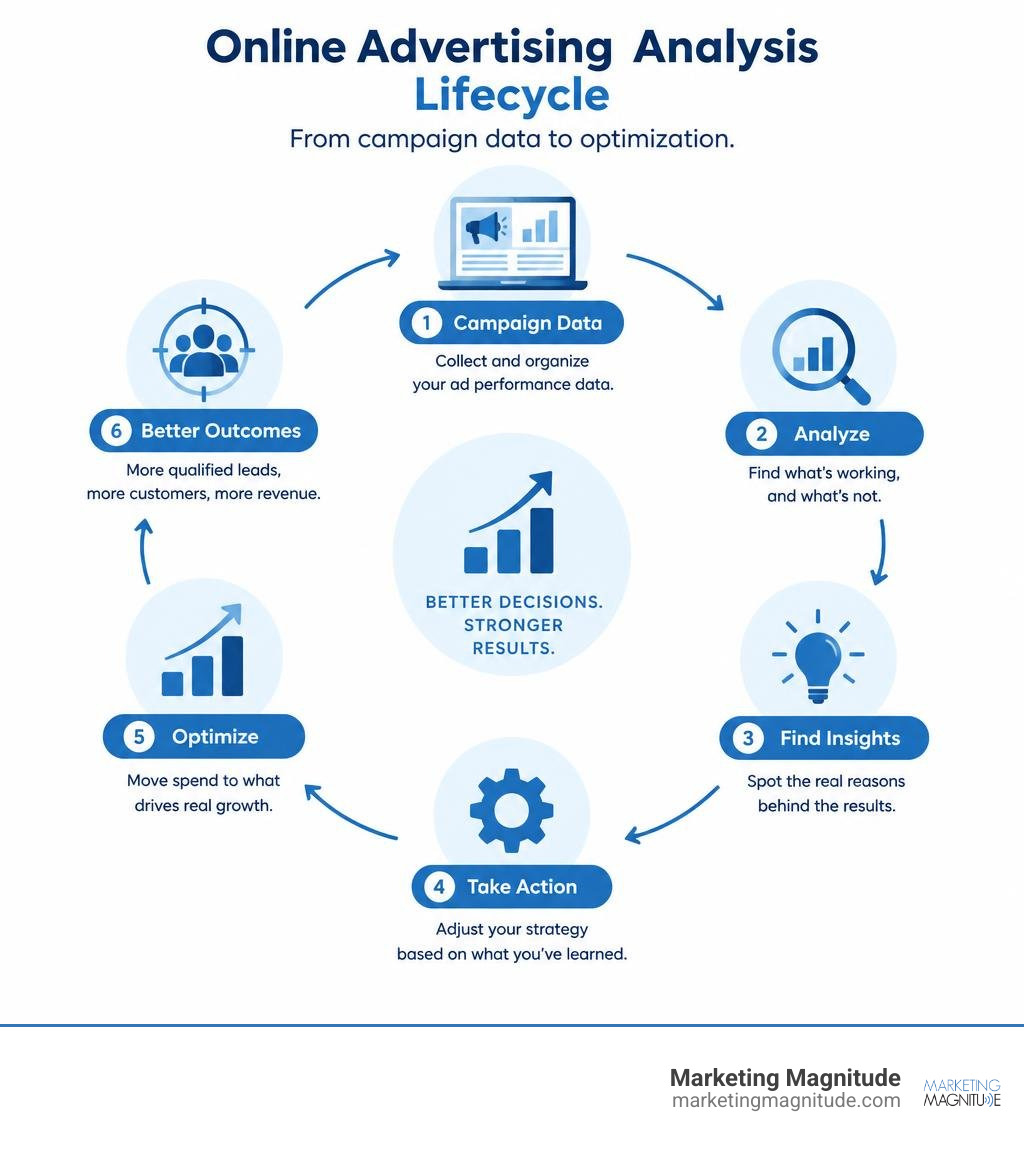
Online advertising analysis means connecting campaign data to business outcomes, then using it to make one clear next decision. Start by checking whether your ads are reaching the right people, earning attention, generating qualified leads, and producing profitable customers – not just clicks.
A simple first-pass review looks like this:
- Compare CTR, cost per click, conversion rate, CPA, and ROAS against your own recent baseline.
- Break results down by channel, campaign, audience, placement, device, and creative.
- Find the biggest leak: weak ad engagement, expensive traffic, a poor landing-page conversion rate, or slow lead follow-up.
- Change one meaningful variable at a time, then measure whether the result improves.
This discipline matters because advertising has become more fragmented and harder to measure. Mobile represented 59% of online advertising revenue in 2025, while privacy changes, ad blocking, and incomplete platform reporting make a single dashboard metric an unreliable source of truth. Strong analysis combines campaign data with CRM outcomes, such as booked appointments, sales opportunities, revenue, and customer value.
The goal is not to produce more reports. It is to identify where budget is being wasted, understand why a campaign is underperforming, and move spend toward the ads and channels that create real growth.
I’m Kelly Rossi, founder of Marketing Magnitude, with more than 20 years of experience connecting SEO, PPC, CRM, automation, and reporting for service businesses. My approach to online advertising analysis focuses on making campaign performance visible from the first click through lead follow-up and revenue.
Handy online advertising analysis terms:
Macro Market Dynamics and the Evolution of Digital Media Spend
Online marketing has evolved from simple text links into an expansive, algorithmic ecosystem. Looking back, internet advertising spend in the United States reached $83.0 billion in 2017 (a 14% climb over 2016) and surpassed $125.2 billion by 2019, outpacing traditional television by over $54 billion.
According to comprehensive global online advertising market report projections, the worldwide market reached $499.95 billion in 2025 and is projected to expand to $1,329.88 billion by 2033, demonstrating a 13.0% compound annual growth rate (CAGR). North America maintains the highest market share, capturing over 34% of overall revenue in 2025.
Regional analysis from U.S. online advertising market trends indicates that maintaining market share requires sophisticated performance monitoring. As media spends increase, advertising channels have fragmented across search engines, paid social feeds, retail media networks, and connected television (CTV). Treating these environments as isolated silos hides the cross-channel interactions that drive real conversions.
Platform Dominance, Mobile Growth, and Search Trajectories
Historically, Google and Meta captured roughly 70% of total U.S. digital ad revenues. While their foundational networks remain central to growth, modern delivery models operate across programmatic ad exchanges, demand-side platforms (DSPs), and supply-side platforms (SSPs) utilizing real-time bidding (RTB).
Mobile devices accounted for 59% of all digital advertising revenue in 2025. This structural shift makes mobile-first creative formatting essential. Search advertising captured a 33% revenue share in 2025, while digital video inventory continues to expand rapidly with an anticipated 16% CAGR through 2033. Programmatic delivery automates bids within milliseconds across these devices, requiring advertisers to evaluate metrics dynamically rather than relying on weekly aggregate spreadsheets.
Privacy Shifts, Signal Loss, and Cookieless Tracking Challenges
Consumer privacy initiatives have restructured how platforms track user behavior. Digital users are exposed to an estimated 5,000 commercial messages daily, up from roughly 500 per day in the 1970s. Studies by privacy research groups revealed that RTB environments expose an average American’s online data 747 times per day, resulting in roughly 107 trillion annual bidstream disclosures.
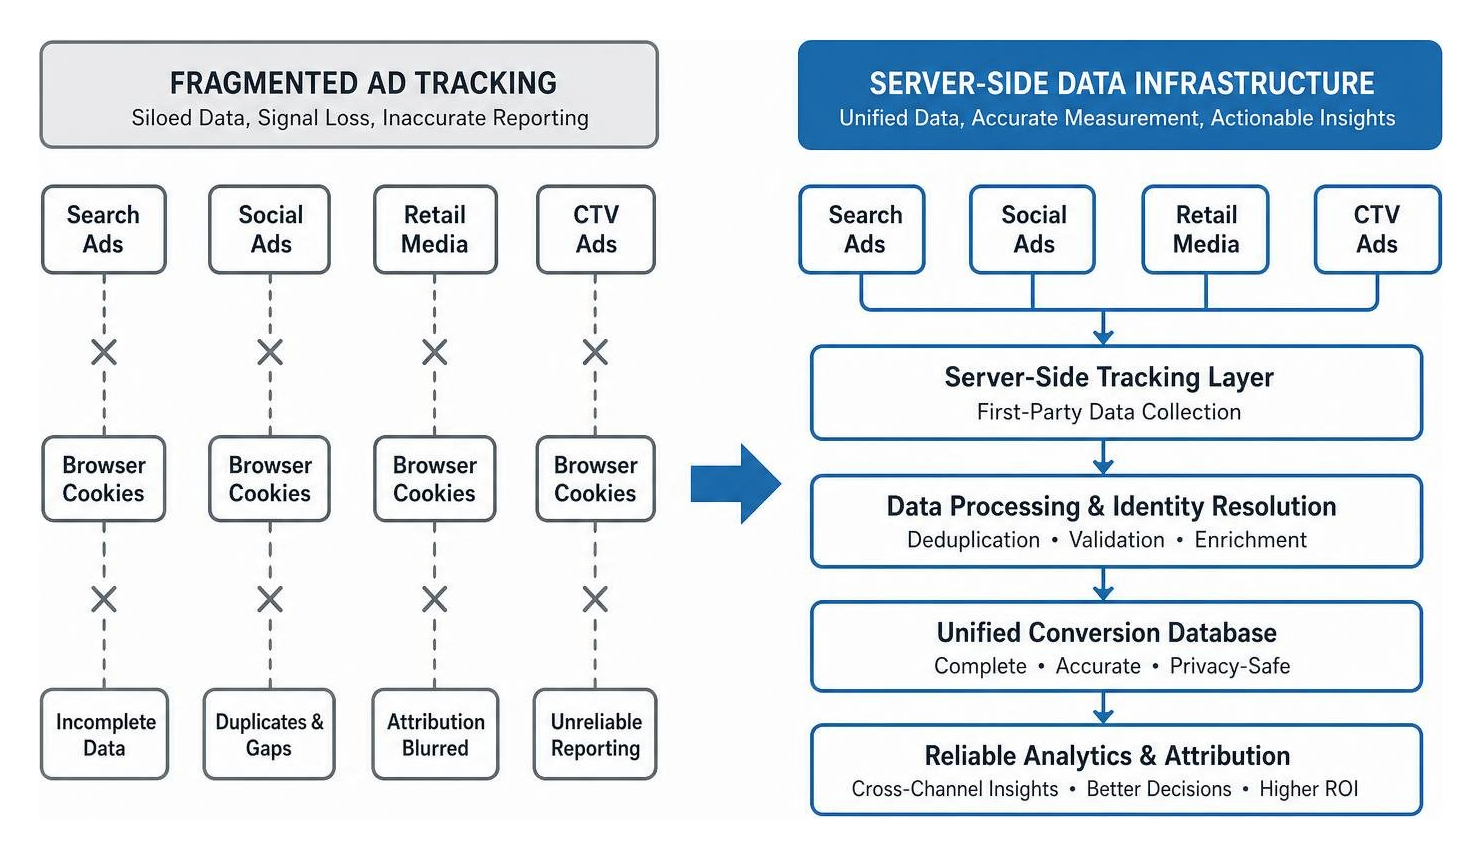
In response, regulatory frameworks, browser tracking restrictions, and consumer ad-blocking adoption have grown. Roughly 27% of general internet users deploy ad-blocking tools, climbing to 58% among technical audiences. Coupled with Apple App Tracking Transparency (ATT) opt-in rates stabilizing near 35% globally, third-party cookies no longer provide reliable measurement.
Relying on unverified browser cookies leads to signal loss and inaccurate campaign reporting. Building sustainable marketing systems requires first-party data architecture, server-side tracking, and conversion APIs to capture accurate conversion data.
Core Dimensions and Methodologies for Online Advertising Analysis
Evaluating an ad account requires looking beyond high-level dashboard summaries. When an ad fails, the breakdown usually happens within specific creative or messaging elements: an uninspired opening, an unclear value proposition, or a disconnected landing page. We examine ad performance by breaking assets down into measurable operational dimensions.

Systematic Workflows for Online Advertising Analysis
To diagnose creative performance systematically, teams can utilize a six-dimension diagnostic scorecard. Each asset is evaluated on a clear scale: 0 (absent/broken), 1 (present but weak), and 2 (strong and unmistakable).
- Hook (The First 3 Seconds): The opening visual and audio beat must capture attention before the user scrolls past. Hooks fall into distinct categories: problem-first callouts, pattern interrupts, specific data points, direct questions, or curiosity gaps.
- Audience Signal: The asset must immediately signal who the message is for, discouraging accidental clicks from unqualified viewers while drawing in the target customer profile.
- Proof Hierarchy: Unsubstantiated claims waste budget. Strong ads feature verifiable evidence: live product demonstrations, before-and-after results, customer case studies, or third-party endorsements.
- Offer Clarity: The viewer must instantly understand the value proposition and the direct action required, paired with clear risk-reversal elements like guarantees or straightforward consultations.
- Format Fit: Assets should match the native technical specifications of the target placement (such as 9:16 vertical video for mobile reels) with legible on-screen typography and clear sound-off readability.
- Landing Page Match: The destination page must mirror the headline, visual aesthetics, promotional terms, and core tone of the ad. Mismatches here create immediate drop-offs.
A disciplined teardown workflow follows a structured cadence: watch the asset cold twice, map time-stamped structural beats, apply the 0–2 scoring across all six dimensions, pinpoint the lowest-scoring variable, and formulate a single-variable test hypothesis to guide the next production cycle.
AI-Driven Creative and Online Advertising Analysis
Machine learning models have transformed creative performance analysis. Rather than manually logging hundreds of ad variations into spreadsheets, multimodal computer vision and natural language processing models can systematically label structural ad elements at scale.
Using platforms like AdGPT or GetCrux, creative teams can break down video assets scene-by-scene, map messaging angles directly to cost-per-acquisition (CPA), and evaluate hooks before committing budget. Specialized diagnostic engines, such as those highlighted in AI Creative Analysis for Meta Ads: Find Your Winners and the Ad Creative Analysis 2026: 6-Dimension Scorecard & Teardown SOP, allow marketers to establish baseline metrics across several core performance layers:
- Attention (Thumbstop Rate): Measures 3-second video views divided by total impressions, reflecting top-of-funnel hook strength.
- Retention (Hold Rate): Evaluates drop-off curves across the middle segment of the video, highlighting whether message delivery holds interest.
- Interest (Outbound CTR): Tracks link clicks to identify whether the messaging successfully motivates consideration.
- Conversion (Post-Click CVR): Evaluates landing page performance and initial lead qualification.
- Durability (CTR Decay): Tracks the onset of creative fatigue as frequency rises over time.
- Unit Economics (Marginal ROAS): Measures revenue generation against account contribution margins.
Automating these diagnostic checks helps identify winning creative structures, prevent creative fatigue, and generate structured briefs for subsequent design cycles.
Full-Funnel Metric Triangulation and Diagnostic Frameworks
Evaluating campaign success through a single attribution model often leads to misallocated capital. Platforms often claim credit for the same conversion, creating an illusion of high performance while masking underlying inefficiencies.
| Measurement Dimension | Attribution Modeling | Marketing Mix Modeling (MMM) | Incrementality Testing |
|---|---|---|---|
| Primary Focus | Tactical path tracking & real-time optimization | Top-down channel allocation & macro budgeting | Causal proof & true conversion lift |
| Data Requirements | User touchpoints, click paths, server events | Historical spend, revenue, external macro variables | Matched market testing, geo-holdouts, ghost bids |
| Strengths | Fast feedback loop; granular keyword/ad-level data | Privacy-resilient; evaluates offline & brand channels | Eliminates attribution bias; proves causality |
| Limitations | Vulnerable to browser privacy blocks & signal loss | Requires high spend scale & months of stable data | Operationally complex; requires holdout spend |
| Best Application | Day-to-day campaign bid and ad adjustments | Quarterly and annual executive budget planning | Validating platform reporting and true baseline lift |
Triangulating Attribution, MMM, and Incrementality
Sophisticated campaign analysis uses a triangulated measurement framework to confirm that advertising is driving incremental business results rather than capturing users who were already planning to convert.
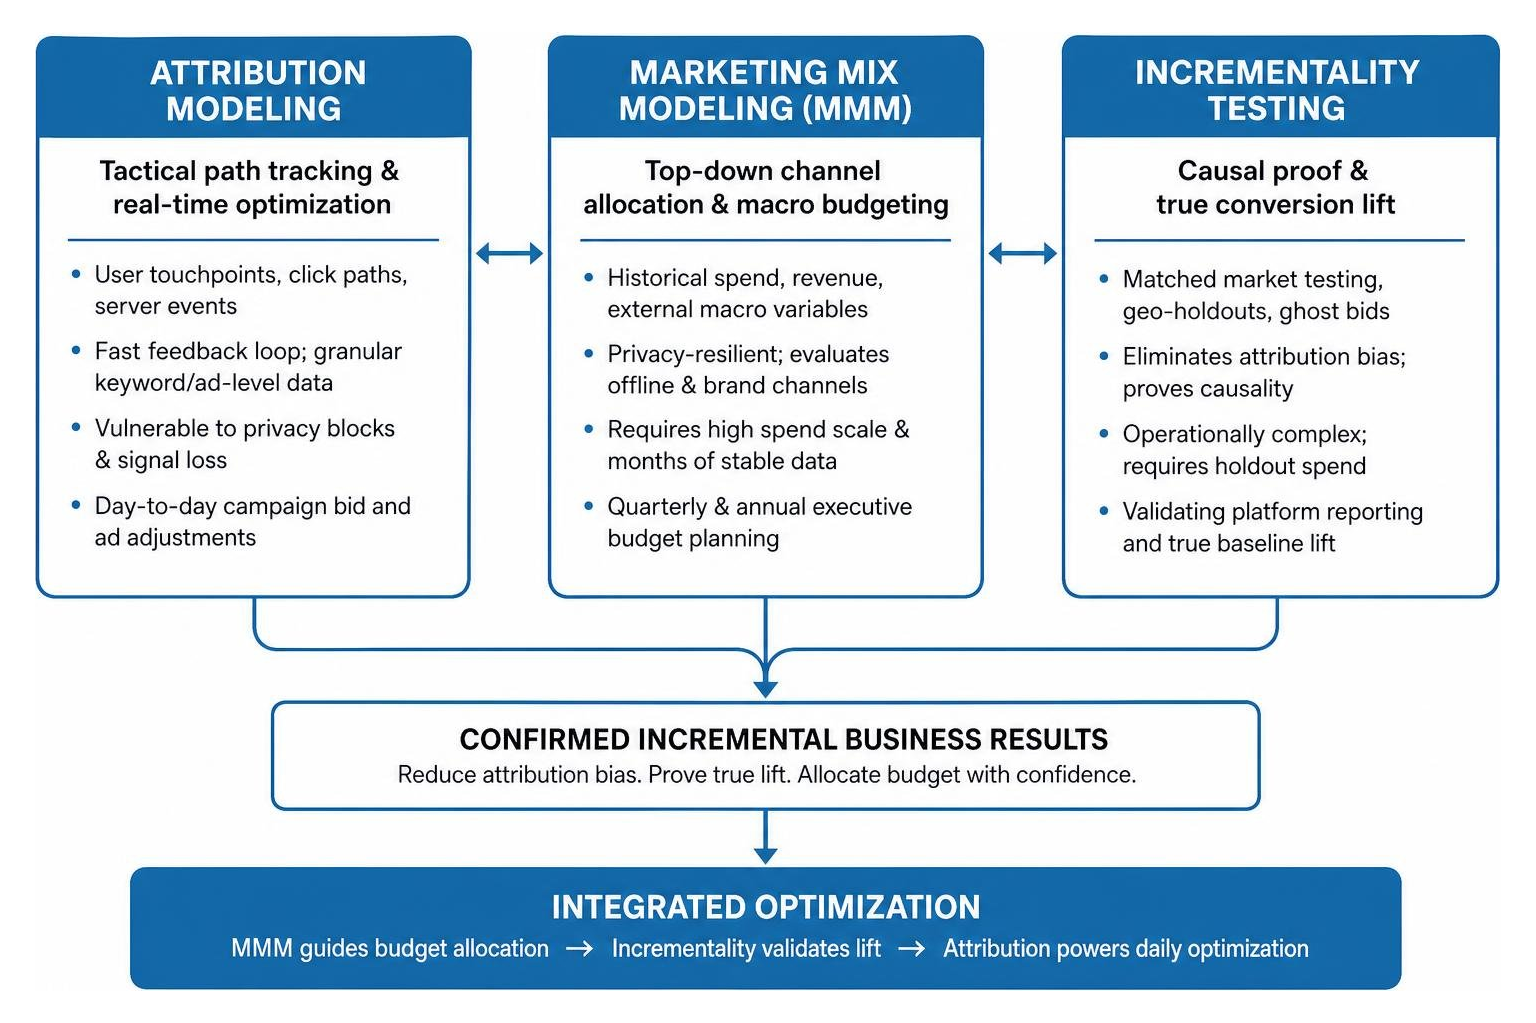
At Marketing Magnitude, our approach to data-driven paid advertising and PPC management relies on this multi-layered framework. We start with marketing mix modeling to guide top-level budget allocation across search, social, and programmatic channels.
Next, we run periodic geo-lift or audience holdout tests to calculate true incrementality. Finally, we use multi-touch attribution dashboards powered by server-side tracking to handle day-to-day campaign optimization, bid adjustments, and creative rotations.
Open-source diagnostic tools, such as the mathiaschu/meta-ads-analyzer and agentic workflows like the Ad Campaign Analyzer for Claude Code, make it easier to query raw account data directly, diagnose platform learning phases, evaluate auction overlap, and detect conversion pacing issues.
Root-Cause Diagnostics for Campaign Inefficiency and Budget Waste
When cost per acquisition spikes, ad accounts typically suffer from a few common operational leaks:
- Broad-Match Search Bleed: Search campaigns without disciplined negative keyword lists waste budget on low-intent, informational queries that rarely convert.
- Zero-Conversion Spend Pools: Budget often accumulates behind ad sets that generate clicks but fail to deliver downstream sales opportunities.
- Learning Phase Instability: Frequent budget adjustments, low conversion volumes (under 30 to 50 events per week), or overlapping audience targeting keep campaigns trapped in “Learning Limited” status.
- Auction Overlap and Internal Competition: Competing ad sets within the same account drive up internal clearing prices, reducing overall delivery efficiency.
- Frequency Saturation: High ad repetition within narrow audiences accelerates creative fatigue, depressing click-through rates and raising acquisition costs.
Pruning non-converting search queries, consolidating fragmented ad sets, and setting firm frequency caps helps preserve capital for high-performing segments.
Unifying Advertising Intelligence with Operational Systems
Marketing data only tells half the story. High click-through rates and low front-end costs-per-lead mean very little if those prospects never convert into paying clients. Sustainable growth requires connecting front-end campaign analytics with back-end operational systems.

Aligning Paid Traffic with CRM and Automation Pipelines
A high-performing campaign ecosystem links every ad click directly to pipeline milestones inside your customer relationship management software.
By integrating your campaigns with our CRM software and marketing automation platform, your team gains visibility into how paid leads move from initial inquiry to closed revenue:
- Automated Lead Routing: New ad inquiries are instantly directed to the appropriate team member, reducing speed-to-lead friction.
- CRM-Triggered Nurture Sequences: Personalized email and SMS workflows trigger automatically based on the specific ad offer and landing page interaction.
- Pipeline Velocity Tracking: Real-time visibility shows how quickly paid prospects advance through qualification, consultation, and proposal stages.
- Closed-Loop Conversion Feedback: Offline sales data and closed deals are passed back to ad platforms via server-side APIs, training algorithmic bidding engines on actual customer value rather than superficial form-fills.
This closed-loop structure prevents teams from scaling ad sets that produce unqualified leads, focusing spend on the campaigns that generate reliable customer lifetime value.
Cross-Channel Synergy Between Organic and Paid Search
Paid advertising and organic search work best as complementary parts of a unified search strategy. Rather than managing them in isolation, analyzing their shared performance uncovers valuable operational efficiencies.
By coordinating paid campaigns with our search engine optimization strategies, businesses can capture maximum real estate on high-intent search engine result pages:
- High-Intent Query Harvesting: Converting search queries identified in paid search campaigns provide proven topics for long-form SEO content and landing page optimization.
- SERP Real Estate Domination: Combining top organic rankings with paid search placements builds brand credibility and captures a higher total share of search.
- Defensive Brand Coverage: Bidding on branded search terms protects your pipeline from competitor conquesting while maintaining a consistent user journey.
- Budget Reallocation: For search terms where your site holds a dominant organic position and competitor ad activity is low, paid spend can be strategically shifted toward more competitive non-branded opportunities.
This balanced approach ensures paid media and organic search support one another, driving down blended customer acquisition costs over time.
Frequently Asked Questions About Campaign Performance
What is the difference between average ROAS and marginal ROAS in ad analysis?
Average return on ad spend (ROAS) calculates total generated revenue divided by total advertising spend over a given period. It provides a historical overview of aggregate performance.
Marginal ROAS measures the incremental revenue generated by the next additional dollar invested. Because all ad channels face diminishing returns as audience saturation occurs, marginal ROAS is often significantly lower than average ROAS.
Tracking marginal return curves helps advertisers identify the exact spend threshold where increasing budget produces diminishing returns, protecting overall campaign profitability.
How do privacy regulations and tracking limitations affect modern ad evaluation?
Modern privacy regulations (including GDPR and state privacy frameworks) alongside browser-level tracking protections restrict the transmission of third-party user identifiers. This creates attribution blind spots when relying entirely on standard browser pixels.
Advertisers address these tracking gaps by adopting first-party data strategies, implementing server-side tracking (such as Meta Conversions API and Google Tag Manager Server-Side), and utilizing platform-modeled conversion data.
For broader strategic planning, organizations increasingly rely on privacy-safe measurement methods like marketing mix modeling and geo-lift testing rather than pure multi-touch click tracking.
How can performance teams systematically diagnose ad creative fatigue?
Ad creative fatigue occurs when target audiences are repeatedly exposed to the same creative assets, leading to audience disengagement and rising acquisition costs. Performance teams diagnose fatigue by monitoring key warning signs:
- A sustained downward trend in 3-second thumbstop rates and hold rates.
- A steady decline in outbound click-through rates (CTR) alongside rising campaign frequency metrics.
- Upward drift in cost-per-click (CPC) and cost-per-acquisition (CPA) over consecutive rolling 7-day windows.
When these indicators emerge, teams should rotate in new hook variations, refresh visual concepts, or adjust audience targeting parameters to stabilize performance.
Conclusion: Transforming Advertising Analysis into Sustainable Business Growth
Effective digital advertising analysis is not an isolated exercise in pulling platform reports or tracking vanity metrics. True performance visibility requires examining every link in the customer acquisition chain—from the first three seconds of video creative to automated lead follow-up and long-term customer retention.
When performance teams unite creative diagnostics, triangulated measurement frameworks, and integrated CRM infrastructure, marketing spend shifts from an unpredictable expense into a reliable, scalable engine for business growth.
Explore how our tailored business growth services can help your team unify paid media, marketing automation, and operational analytics into a cohesive system built for sustainable scale.
Get Started Now
Fill out this form to start your journey to next-level marketing solutions for your business.