Why Tracking Conversion Rate in Google Analytics Actually Matters
Conversion rate in Google Analytics is one of the most important numbers your business can track — and as of 2026, it looks a little different than it used to.
Here is a quick answer if you need it fast:
How to find your conversion rate in Google Analytics (GA4):
- Go to Reports > Acquisition > Traffic Acquisition
- Click the pencil icon (top right) to customize the report
- Under Metrics, click Add metric
- Search for and add Session key event rate or User key event rate
- Click Apply and Save
Note: GA4 officially renamed “conversion rate” to Key Event Rate in January 2026. If you are looking for a “conversion rate” column and cannot find it, this is why.
There are two versions of this metric in GA4:
- Session key event rate — the percentage of sessions that included a key event (conversion)
- User key event rate — the percentage of users who triggered a key event at least once
Both are calculated differently and tell you different things about your marketing performance. We will break this down fully in the next section.
GA4 did not always make this easy. When Google first launched GA4, conversion rate was not even a visible metric in standard reports. Business owners who relied on this number in Universal Analytics were left searching for something that simply was not there by default. That frustration is real — and it is still common today, especially after the 2026 terminology update.
I am Kelly Rossi, founder of Marketing Magnitude, and I have spent over 20 years helping businesses track and improve their conversion rate in Google Analytics across industries ranging from healthcare to professional services to e-commerce. In this guide, I will walk you through exactly how to find, set up, and analyze your conversion data in GA4 — the right way.
Understanding Conversion Rate in Google Analytics: Session vs. User Metrics
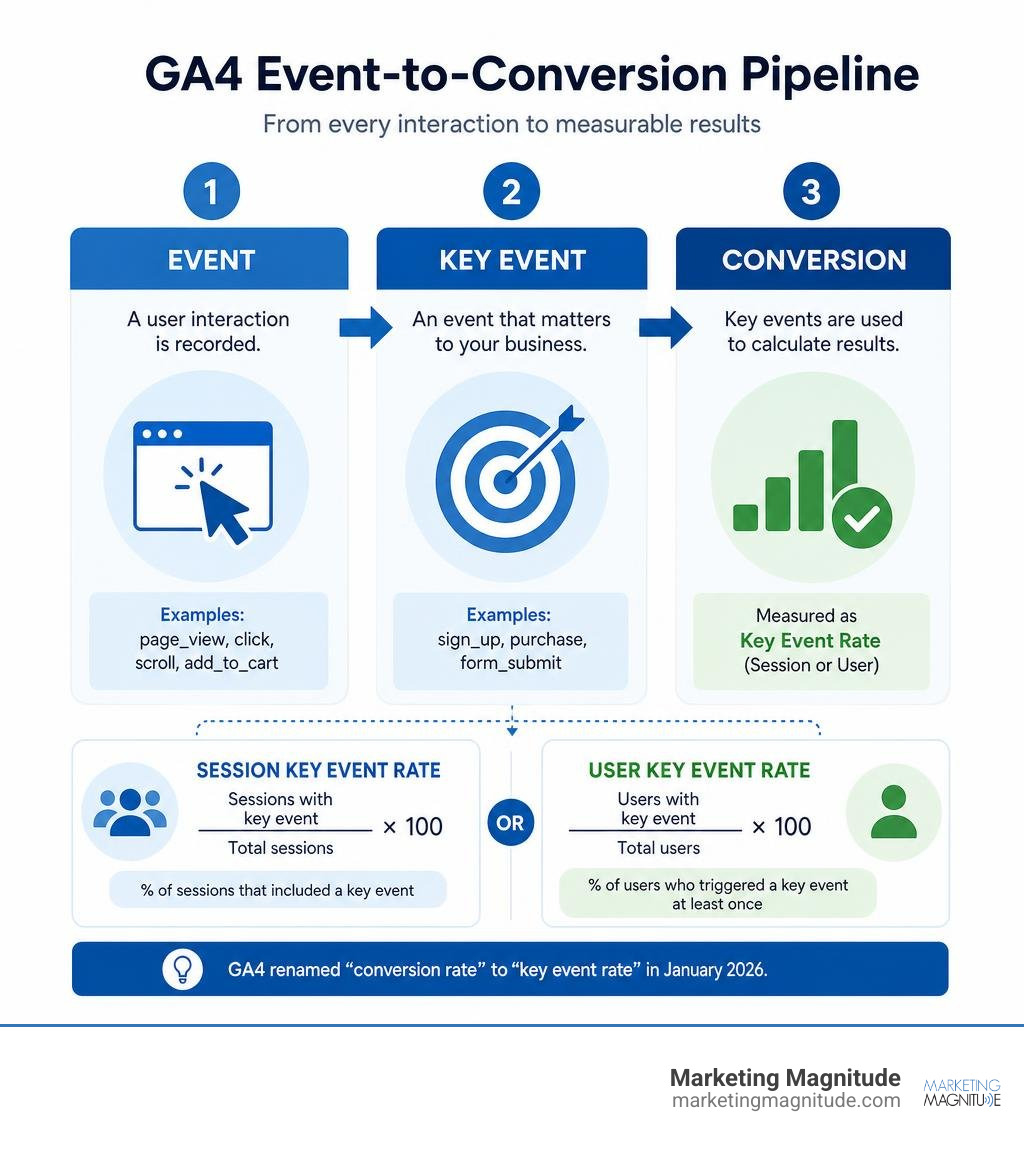
To make sense of your data, you first need to understand the fundamental shift in how Google Analytics calculates success. In the legacy version of Google Analytics (Universal Analytics), we had a single, session-based conversion rate. GA4 changed the game by introducing two distinct metrics, which were officially renamed to “key event rates” in early 2026.
Let’s look at how both of these metrics are calculated:
- Session key event rate (formerly session conversion rate) is calculated by dividing the number of sessions in which a key event was triggered by the total number of sessions.
- User key event rate (formerly user conversion rate) is calculated by dividing the number of unique users who triggered a key event by the total number of unique users on your site.
To see how this works in the real world, imagine a user lands on your professional services website via an organic search. They read a blog post, look at your service pages, but do not reach out. The next day, they return through an email newsletter and fill out your consultation form (a designated key event).
In this scenario:
- The user completed 2 sessions and converted in 1. This results in a Session key event rate of 50% (1 converted session divided by 2 total sessions).
- The user is 1 unique individual who converted once. This results in a User key event rate of 100% (1 converted user divided by 1 total user).
Understanding this difference is critical when analyzing your marketing metrics. The user conversion rate remains stable for a user after their first key event, even if they return for multiple subsequent non-converting sessions. Conversely, your session conversion rate can decrease if a converted user visits your site again and does not convert during that specific new session.
For a deeper dive into these calculations, check out the GA4 Conversion Rate Guide.
| Metric | Calculation Formula | Best Used For |
|---|---|---|
| Session Key Event Rate | (Sessions with a key event / Total sessions) x 100 | Evaluating immediate landing page performance, direct-response campaigns, and short-term promotions. |
| User Key Event Rate | (Users who triggered a key event / Total users) x 100 | Analyzing long-term user acquisition, multi-session sales cycles, and relationship-driven business growth. |
How to Find and Add Conversion Rate Metrics to Standard GA4 Reports
If you open a brand new Google Analytics 4 property, you might notice that neither of these key event rate metrics appears in your standard reports. Google leaves them out of the default views, meaning we have to manually customize our reports to bring them to light.
Fortunately, customizing your standard reports is a straightforward process. We typically recommend adding these metrics directly to your Traffic Acquisition reports to see which marketing channels are driving the highest quality traffic.
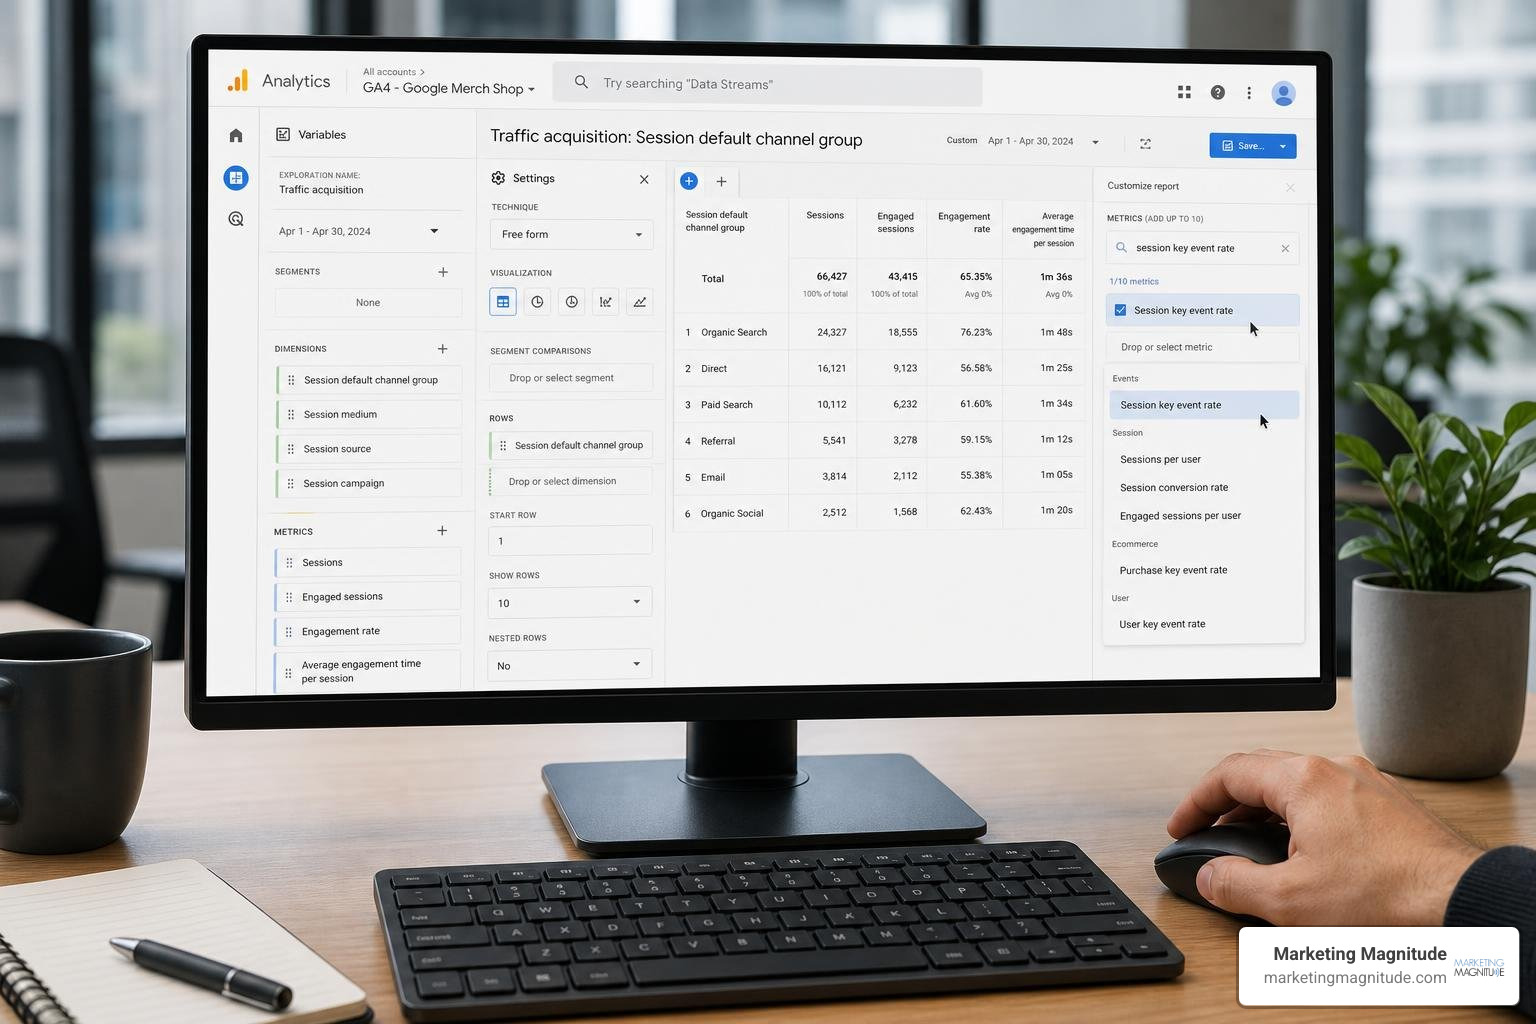
By taking a few minutes to customize your reports, you can transform raw data into actionable insights, helping you master your website marketing analytics. To get a broader overview of tracking methods, you can also read the Google Analytics Conversion Tracking Guide.
Step-by-Step Guide to View Conversion Rate in Google Analytics
Follow these exact steps to add conversion rate (key event rate) metrics to your standard GA4 reports:
- Log into your Google Analytics account and navigate to Reports in the left-hand menu.
- Go to Acquisition > Traffic acquisition.
- Look at the top-right corner of the screen and click the pencil icon (Customize report). If you do not see this icon, it means you do not have Editor or Administrator permissions for the property.
- In the right-hand customization panel, click on Metrics.
- Scroll to the bottom of the metric list and click Add metric.
- Type “key event rate” into the search bar.
- Select Session key event rate and/or User key event rate from the dropdown menu.
- Drag and drop the newly added metrics to position them wherever you prefer in your report table.
- Click Apply in the bottom right of the panel.
- Click Save at the top of the screen. We recommend choosing Save changes to current report so that everyone on your team can access these metrics instantly.
Customizing Explorations for Conversion Rate in Google Analytics
Standard reports are great for quick health checks, but custom Explorations allow you to perform much deeper analyses. If you want to cross-reference your key event rates with specific user segments or custom dimensions, building a Free Form exploration is the way to go.
To set this up:
- Click the Explore tab in the left-hand menu of GA4 and select Blank to start a new exploration.
- In the Variables column, click the plus icon next to Dimensions, search for Session source / medium, check the box, and click Import.
- Next, click the plus icon next to Metrics, search for Session key event rate, check the box, and click Import.
- Double-click your imported dimension (Session source / medium) to add it to the Rows settings, or drag it over.
- Double-click your imported metric (Session key event rate) to add it to the Values settings.
You now have a clean, custom report showing exactly which search engines, social platforms, and referral sources are sending traffic that actually converts. Always remember to use session-scoped dimensions (like Session source / medium) when analyzing session-scoped metrics to keep your data accurate.
Setting Up Custom Conversion Tracking and Key Events in GA4
Before you can measure a conversion rate, you must define what a “conversion” actually means for your business. In GA4, all tracking is built on events. The pipeline moves from a raw Event to a Key Event (marked in GA4), and finally to a Conversion (when imported into Google Ads).
By default, GA4 only automatically marks the purchase event as a conversion (along with a few select mobile app events). If you want to track lead forms, button clicks, phone calls, or newsletter sign-ups, you must set them up manually. GA4 allows you to mark up to 30 custom events as key events per property.
To mark an event as a key event:
- Navigate to your GA4 Admin panel (the gear icon in the bottom left).
- Under the Data display menu, click on Events.
- Locate the custom event you want to track (for example, generate_lead).
- Toggle the switch under the Mark as key event column to the active position.
If the event has not fired yet in the last 24 to 48 hours, it will not appear in this list. In that case, click the Key events tab (just below the Events tab in Admin), click New key event, and type the exact name of your event. Always use snakecase naming conventions (lowercase letters with underscores, such as signup_complete) to prevent tracking errors.
For official documentation on managing these settings, you can refer to the Google Analytics Help on Conversions. If you want to make sure your tracking is configured flawlessly, our team at Marketing Magnitude specializes in advanced website conversion tracking setups.
Tracking Custom Conversions with Google Tag Manager
While GA4 can track basic page views automatically, tracking interactive elements like button clicks, video plays, or form submissions usually requires Google Tag Manager (GTM).
To set up a custom button click trigger in GTM:
- Open your GTM container and create a new Trigger.
- Choose Just Clicks or All Elements as the trigger type, and set it to fire on “Some Clicks.”
- Define the condition using your button’s unique ID or class (e.g., Click ID equals submit-button).
- Create a new Tag using the Google Analytics: GA4 Event template.
- Set your Configuration Tag, name your event something descriptive (like contactbuttonclick), and link it to your newly created trigger.
- Click Preview in GTM to test your trigger in real-time. Verify that the tag fires when you click the button, then publish your container. Once the event registers in GA4, you can toggle it as a key event in your Admin panel.
How to Recreate an Ecommerce Conversion Rate in GA4 Explorations
For e-commerce businesses, tracking the classic “transactions divided by sessions” rate is vital. However, if you simply look at the default Session Key Event Rate column in GA4, the number might look artificially high or confusingly low.
Why does this happen? Because by default, the Session Key Event Rate calculates the percentage of sessions that contained any key event. If you are tracking newsletter signups, add-to-carts, and purchases all as key events, your overall rate will be a combined average of all of them.
To isolate and recreate a pure e-commerce conversion rate (purchases only) in GA4 Explorations, you must apply a specific filter:
- Create a new Blank Exploration.
- Add Session source / medium as your dimension and Session key event rate as your metric.
- Drag your dimension to Rows and your metric to Values.
- Scroll down to the Filters section in the Settings column.
- Select Event name as your filter dimension.
- Set the match type to matches regex and enter the expression:
session_start|purchase - Click Apply.
This regex filter is a clever workaround. It tells GA4 to keep all sessions (which begin with the session_start event) in the denominator of the calculation, while only counting the purchase event in the numerator. This ensures your calculated percentage represents your true purchase conversion rate without being skewed by other micro-conversions.
To explore how these metrics are structured programmatically for custom reporting dashboards, you can look at the Google Analytics Data API Basics. For a comprehensive look at your digital performance, we always recommend pairing these technical metrics with a complete online marketing analysis.
Best Practices for Analyzing Conversion Rates to Improve Marketing Performance
Now that you have your tracking set up, how do you use this data to grow your business? Raw numbers are only valuable if they lead to strategic improvements. At Marketing Magnitude, we believe that sustainable growth happens when analytics, marketing, and operations work together as one connected system.
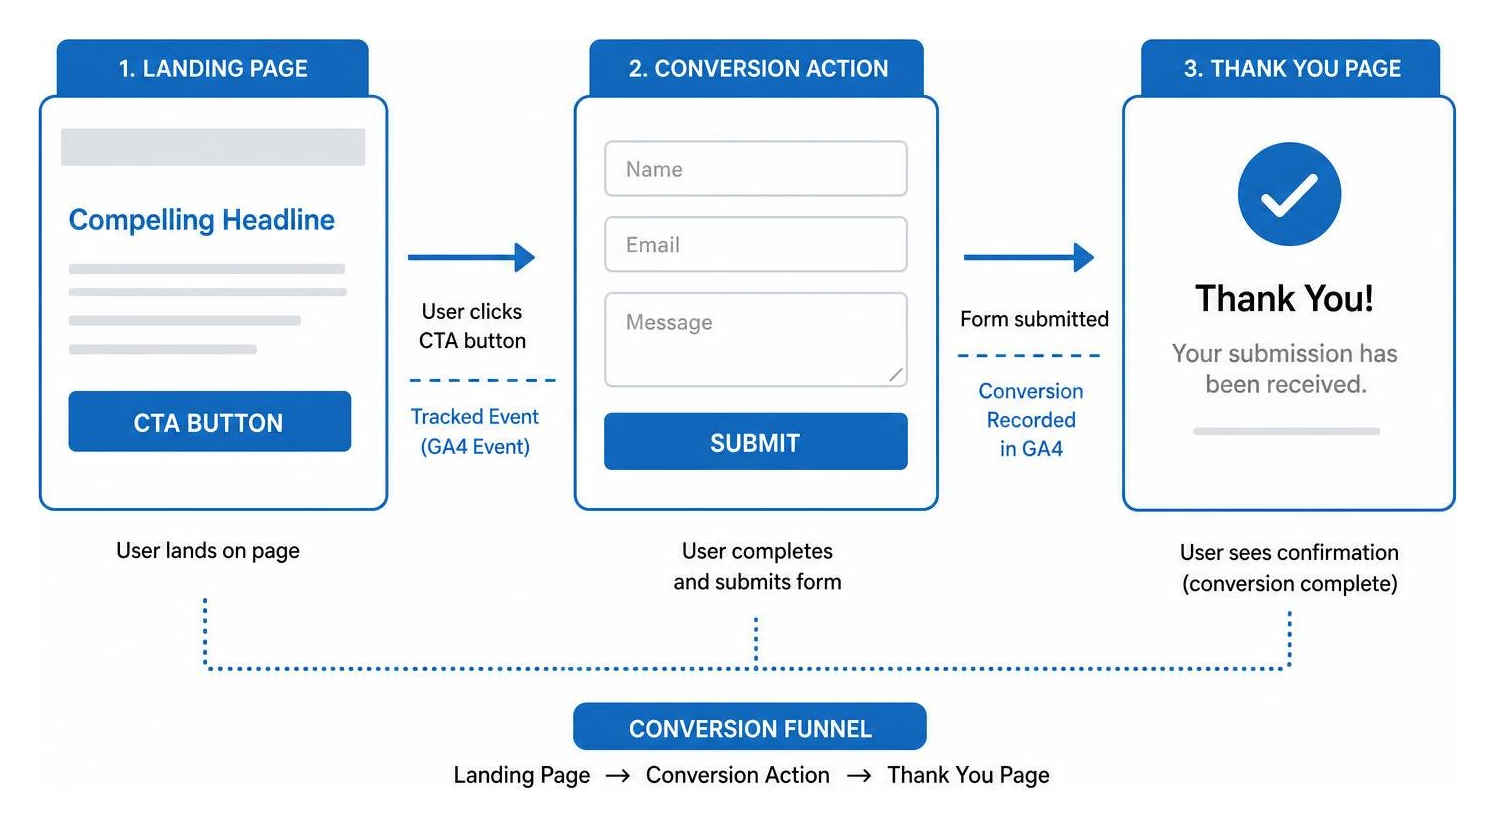
Here are the best practices we use to analyze and optimize conversion rates:
- Use Multi-Channel Attribution Wisely: GA4 defaults to a Data-driven attribution model, which uses machine learning to distribute conversion credit across all user touchpoints. Compare this with last-click data to understand which channels introduce users to your brand versus which channels close the deal.
- Integrate with Your CRM: Do not stop tracking at the website level. Connect GA4 with your CRM platform to follow the user journey from a website click to a closed sale. This is especially critical for trust-based and relationship-driven service businesses where the true conversion happens offline.
- Account for AI Dark Traffic: In 2026, search behavior has changed dramatically. With AI search engines and tools answering questions directly, up to 30% of traffic labeled as “direct” in GA4 may actually originate from AI sources. Monitor your referral and direct traffic closely to identify these shifts.
- Optimize Page Load Speed: User experience is a massive conversion factor. If your landing page takes longer than 3 seconds to load, your abandonment rate will skyrocket. Keep your design clean, optimize your images, and test your site performance regularly.
- Run Structured Tests: Never guess what works. Use your conversion data to identify high-traffic, low-converting pages, and then implement strategic split testing. To learn how to design these experiments, check out our guide on A/B testing for landing pages.
Frequently Asked Questions about GA4 Conversion Rates
Why is my GA4 conversion rate different from my CRM or e-commerce platform?
Discrepancies between analytics platforms and back-end systems are completely normal. They usually happen because of different attribution models, cookie consent settings, ad blockers, or processing delays.
For instance, Google Ads attributes a conversion back to the day of the last ad click to measure ad spend ROI, whereas GA4 attributes it to the actual day the conversion occurred. Additionally, if a user declines cookies via your consent banner, GA4 might rely on machine learning models to estimate conversions, while your CRM simply records the raw, exact transaction.
What is the difference between a Key Event and a Conversion in GA4?
An Event is any basic user action on your site (like a page view or scroll). A Key Event is an event that you have flagged within Google Analytics as highly important to your business success (like a form submission).
A Conversion is created when you link your GA4 property to Google Ads and import that Key Event into your advertising account. This distinction helps keep your website behavioral data clean while allowing your paid campaigns to optimize for specific bidding goals.
Why doesn’t dividing total conversions by total sessions match the Session Key Event Rate?
If you manually divide your total conversions column by your total sessions column in a standard report, the resulting percentage will rarely match the Session Key Event Rate metric. This is because a single session can contain multiple conversion events (for example, a user downloading three different PDFs in one visit).
While the “Conversions” column counts all three actions, the “Session Key Event Rate” metric only calculates whether that session was a converting session or not (a binary yes/no).
Conclusion
Calculating and analyzing your conversion rate in Google Analytics the right way is about more than just checking a box — it is about gaining absolute clarity over your business growth. When you understand the nuances of session versus user metrics, customize your reports, and build connected tracking systems, you can make confident, data-driven decisions that scale your business sustainably.
At Marketing Magnitude, we build complete growth infrastructures that connect your marketing, CRM, automation, and analytics into a single, high-performing ecosystem. We help service-based businesses in Las Vegas, Austin, and throughout the United States turn traffic into lasting customer relationships.
Ready to take control of your data and scale your business? Explore our Website Conversion Tracking Services or reach out to us today for a strategic growth consultation.
Get Started Now
Fill out this form to start your journey to next-level marketing solutions for your business.