The 8 Key Website Analytics Metrics Every Business Must Track
The key website analytics metrics every business must track are active users and new vs. returning visitors, engaged sessions and engagement rate, session and user key event rates, traffic sources and attribution, top landing pages, top exit pages, page load speed and Core Web Vitals, and customer lifetime value and marketing ROI. Together, these eight metrics connect top-of-funnel acquisition to bottom-of-funnel revenue and provide a complete view of your funnel.
Every website generates thousands of data points every week. However, raw data without clear operational context quickly leads to analysis paralysis. As digital transformation accelerates, 72% of B2B business leaders report relying more heavily on data to steer their organizations, yet only 3% of marketers consistently achieve their overarching goals. The gap lies in distinguishing vanity metrics from actionable growth drivers.
| Metric | Calculation / Definition | Primary Business Value |
|---|---|---|
| 1. Active Users & New vs. Returning | Unique visitors active within a specific time window | Evaluates overall brand reach and long-term audience retention. |
| 2. Engaged Sessions & Rate | (Sessions $\ge$10s, with a conversion, or $\ge$2 pageviews) / Total Sessions | Measures content quality and genuine visitor interest. |
| 3. Key Event Rates | (Sessions or Users with a Key Event) / (Total Sessions or Users) | Directly tracks conversion efficiency and lead generation success. |
| 4. Traffic Sources & Attribution | Inbound visits grouped by channel (Organic, Paid, Direct, Referral) | Identifies your most profitable marketing channels to allocate budget. |
| 5. Top Landing Pages | First pages viewed in a session paired with engagement metrics | Identifies initial user touchpoints that effectively capture pipeline interest. |
| 6. Top Exit Pages | Percentage of visits leaving your site from a specific URL | Highlights drop-off friction, confusing layouts, or broken checkout steps. |
| 7. Page Load Speed & Core Web Vitals | Time in seconds for main content to render (LCP, CLS, FID/INP) | Protects search engine rankings and stops technical drop-offs. |
| 8. CLV & Marketing ROI | (Average Order/Contract Value $\times$ Retention Duration) vs. CAC | Validates sustainable business growth and long-term marketing profitability. |
1. Active Users and New vs. Returning Visitors
Tracking your total audience begins with understanding active users. In modern analytics platforms like Google Analytics 4 (used by 73% of top 10,000 websites), “Active Users” represents individuals who have engaged with your website in the foreground, filtering out idle tabs.
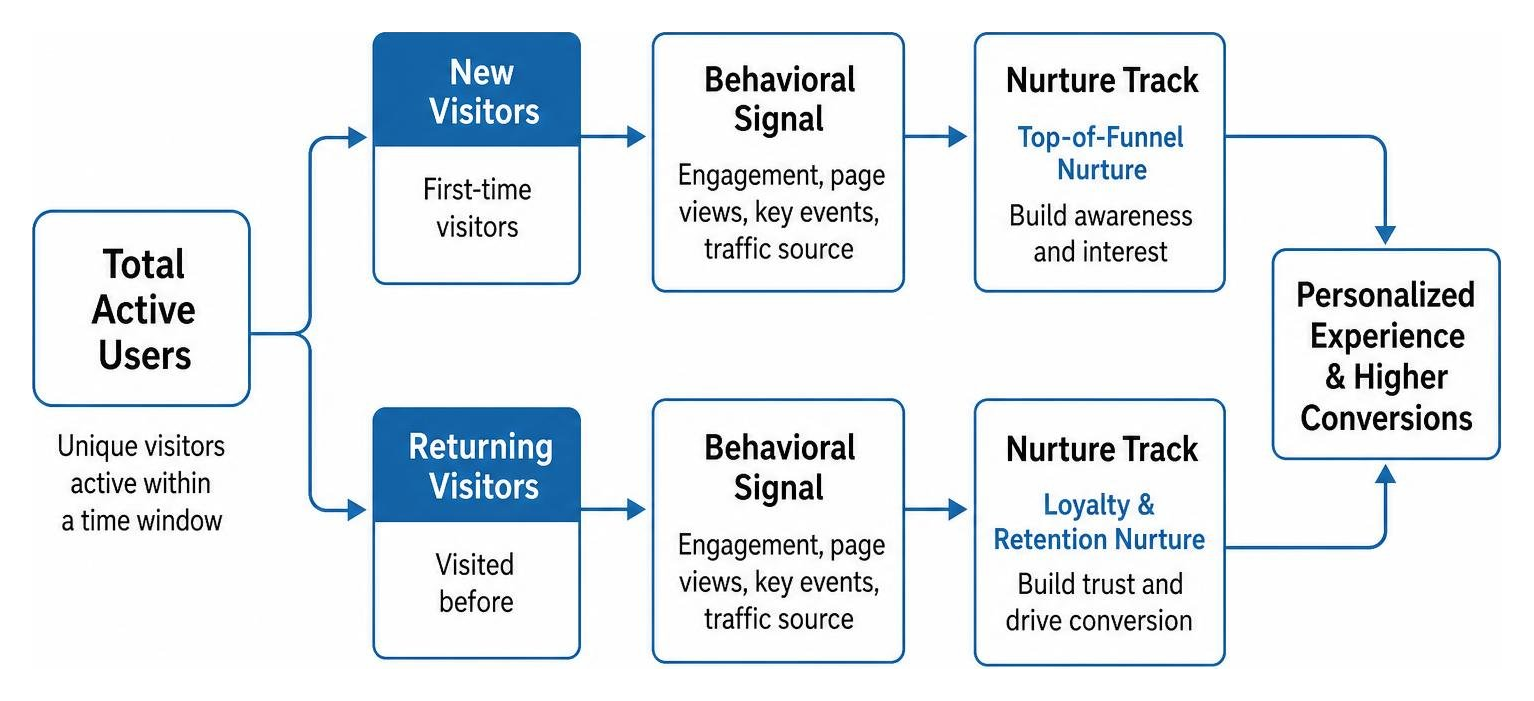
Analyzing the split between new and returning visitors reveals the health of your acquisition engine:
- New Visitors: Reflect the reach of your brand awareness campaigns, top-of-funnel content marketing, and organic search reach.
- Returning Visitors: Indicate brand authority, trust, and client loyalty. For service-based businesses, such as healthcare practices or professional consulting firms, repeat visits often precede high-value inquiries.
Cross-device tracking ensures that when a prospect browses your services on a mobile device and returns via desktop to fill out a contact form, they are attributed as a single active user journey rather than two fragmented visits.
2. Engaged Sessions and Engagement Rate
Legacy platforms relied heavily on Bounce Rate, which simply measured single-page sessions regardless of whether the user spent ten minutes reading a comprehensive guide. Modern analytics measures engagement through Engaged Sessions and Engagement Rate.
An engaged session is defined as any visit that meets at least one of these criteria:
- Lasts longer than 10 seconds
- Triggers at least one Key Event (conversion)
- Includes 2 or more page or screen views
$$ \text{Engagement Rate} = \frac{\text{Engaged Sessions}}{\text{Total Sessions}} \times 100 $$
A healthy baseline across most industries falls between 55% and 70%. When engagement drops below 40% on critical service pages, it points to mismatched search intent or poor design. For custom reporting environments, reviewing default calculated metrics allows marketing teams to maintain standardized engagement formulas across multiple digital properties.
3. Session and User Key Event Rates (Conversion Rates)
A website must generate business outcomes. Conversion rates are categorized as Key Event Rates, separated into two complementary perspectives:
- Session Key Event Rate: The percentage of total sessions in which a key event occurred. This measures the immediate effectiveness of a landing page or campaign.
- User Key Event Rate: The percentage of unique users who completed a key event across their lifecycle. This metric is ideal for B2B and relationship-focused industries with multi-touch buying cycles.
$$ \text{Session Key Event Rate} = \frac{\text{Sessions with a Key Event}}{\text{Total Sessions}} \times 100 $$
Tracking both micro-conversions (such as newsletter signups, guide downloads, or video plays) and macro-conversions (such as consultation bookings and purchases) gives clear visibility into your pipeline.
To explore tracking configurations in detail, review our guide on how to calculate conversion rate in Google Analytics the right way, as well as the latest framework for conversion rate in Google Analytics 4.
4. Traffic Sources and Channel Attribution
Knowing where your visitors originate helps ensure marketing budgets are allocated effectively. Web analytics categorizes inbound traffic into primary channels:
- Organic Search: Drives 53% of all trackable web traffic globally, demonstrating why sustainable SEO remains foundational.
- Paid Advertising (PPC): Captures high-intent prospects through targeted search and display campaigns.
- Direct Traffic: Visitors typing your URL directly or clicking bookmarks, indicating strong brand recall.
- Referral & Social: Inbound visits from partner publications, local directories, or active social media discussions.
Analyzing multi-touch attribution models helps identify which channels introduce prospects to your brand versus which channels close the final booking. You can easily decode campaign metrics with deep digital advertising analysis to ensure your acquisition spend delivers verifiable business returns.
5. Top Landing Pages and Content Performance
Your homepage is rarely the only entry door to your business. Organic search, paid campaigns, and social media regularly direct visitors straight to specific service pages or educational articles.
According to Google’s [GA4] Landing page report, landing page metrics are session-scoped. Evaluating metrics like Average Engagement Time and Key Event Rate per landing page shows whether your introductory messaging aligns with visitor expectations.
High-performing landing pages typically share three traits:
- Clear headlines matching the source query
- Prominent, low-friction calls to action
- Educational copy addressing customer pain points early
6. Exit Pages and Funnel Drop-off Points
Exit rate measures the percentage of visits that end on a specific page after viewing one or more pages across your site. While a high exit rate on a “Thank You” or order confirmation page is expected, high exit rates on pricing pages, multi-step booking forms, or checkout flows indicate friction.
When prospects abandon your funnel unexpectedly, common culprits include:
- Overly complex forms asking for unnecessary information too early
- Hidden fees or unclear pricing structures
- Lack of visible trust signals, client testimonials, or security badges
- Broken navigation or poor mobile responsiveness
Identifying these drop-off points allows you to systematically remove obstacles and streamline user pathways.
7. Page Load Speed and Core Web Vitals
User experience and technical performance are directly linked. Approximately 64.95% of global website traffic originates from mobile devices, where connection speeds and hardware vary widely.
A delay of just one single second in page load time can reduce conversions by 7%, while 60% of consumers abandon a digital experience entirely due to poor usability. Search engines treat technical performance metrics—specifically Google’s Core Web Vitals (Largest Contentful Paint, Cumulative Layout Shift, and Interaction to Next Paint)—as direct ranking signals. Maintaining load times under two seconds protects both your organic rankings and conversion efficiency.
8. Customer Lifetime Value (CLV) and Marketing ROI
Traffic and engagement metrics only tell part of the story; sustainable businesses must connect website behavior to revenue. Customer Lifetime Value (CLV) measures the total revenue a business can reasonably expect from a single customer relationship over time.
$$ \text{Marketing ROI} = \frac{(\text{Revenue Attributed to Marketing} – \text{Marketing Costs})}{\text{Marketing Costs}} \times 100 $$
By connecting website conversion data with CRM pipelines, businesses can calculate true Customer Acquisition Cost (CAC) against CLV. For service businesses where trust and repeat relationships drive value, tracking this connection ensures marketing investments generate sustainable growth. To build a solid foundation for this analysis, consult our guide to online marketing analysis.
Strategic Framework: Tracking Metrics by Business Model and Scale
Not all organizations should track analytics in the exact same manner. Tailoring your KPI framework to your business model ensures your team focuses on data that supports operational execution.

Categorizing Key Website Analytics Metrics for B2B, eCommerce, and SaaS
Different business models require different measurement priorities.
| Metric Focus | B2B & Professional Services | eCommerce & Retail | SaaS & Digital Platforms |
|---|---|---|---|
| Primary KPI | Qualified Lead Volume & Pipeline Value | E-commerce Conversion Rate & AOV | Trial-to-Paid Rate & Monthly Recurring Revenue (MRR) |
| Engagement Focus | Engagement Time on Service & Case Study Pages | Cart Abandonment Rate & Product Views | Feature Adoption Rate & Daily/Monthly Active Users |
| Funnel Metric | Form Submissions & Consultation Bookings | Checkout Step Completion Rates | User Onboarding Funnel Completion |
| Key Benchmark | Long sales cycles requiring multi-touch attribution | Average cart abandonment rate near 70% | Product stickiness and churn mitigation |
For an in-depth breakdown of standard metrics, review our foundational guide on marketing metrics 101 to know if your marketing is working.
How Solopreneurs and Small Teams Prioritize Key Website Analytics Metrics
Small business owners and solopreneurs often fall into the trap of checking daily analytics counters—a practice that reflects natural daily variance rather than clear strategic signals.
To prevent analysis fatigue, small teams should focus on five core numbers:
- Top Traffic Sources: To know which marketing channel deserves ongoing effort.
- Top 3 Landing Pages: To verify that primary entry points are engaging visitors.
- Site-wide Engagement Rate: To confirm overall content relevance.
- Primary Key Events: Form fills, phone calls, or direct purchases.
- Top Exit Pages: To catch and resolve conversion friction points quickly.
Reviewing these metrics on a monthly cadence provides enough data to spot real trends. For structured weekly maintenance, consult our guide on 5 key metrics every business owner should check weekly.
Setting Up GA4 Dashboards and Actionable Tracking Workflows
Building an actionable reporting interface ensures that team members and leadership can assess website performance quickly without navigating complex nested menus.

Configuring Key Events and Conversion Pathways
GA4 operates on an event-based architecture. Instead of waiting for pre-configured goals, you define the custom events that matter to your business:
- Tag Implementation: Deploy tags using Google Tag Manager to track form submissions, button clicks, and downloads cleanly.
- Flagging Key Events: Mark critical actions as “Key Events” inside your GA4 property settings.
- Funnel Exploration: Build custom Path and Funnel Explorations to track the steps users take before converting.
For a step-by-step setup walkthrough, explore our detailed resource on website conversion tracking.
Establishing a Monitoring Cadence: Spotting Real Trends vs. Noise
Analyzing metrics at the wrong frequency leads to premature strategy shifts. Setting a disciplined operational cadence prevents overreacting to short-term data fluctuations.
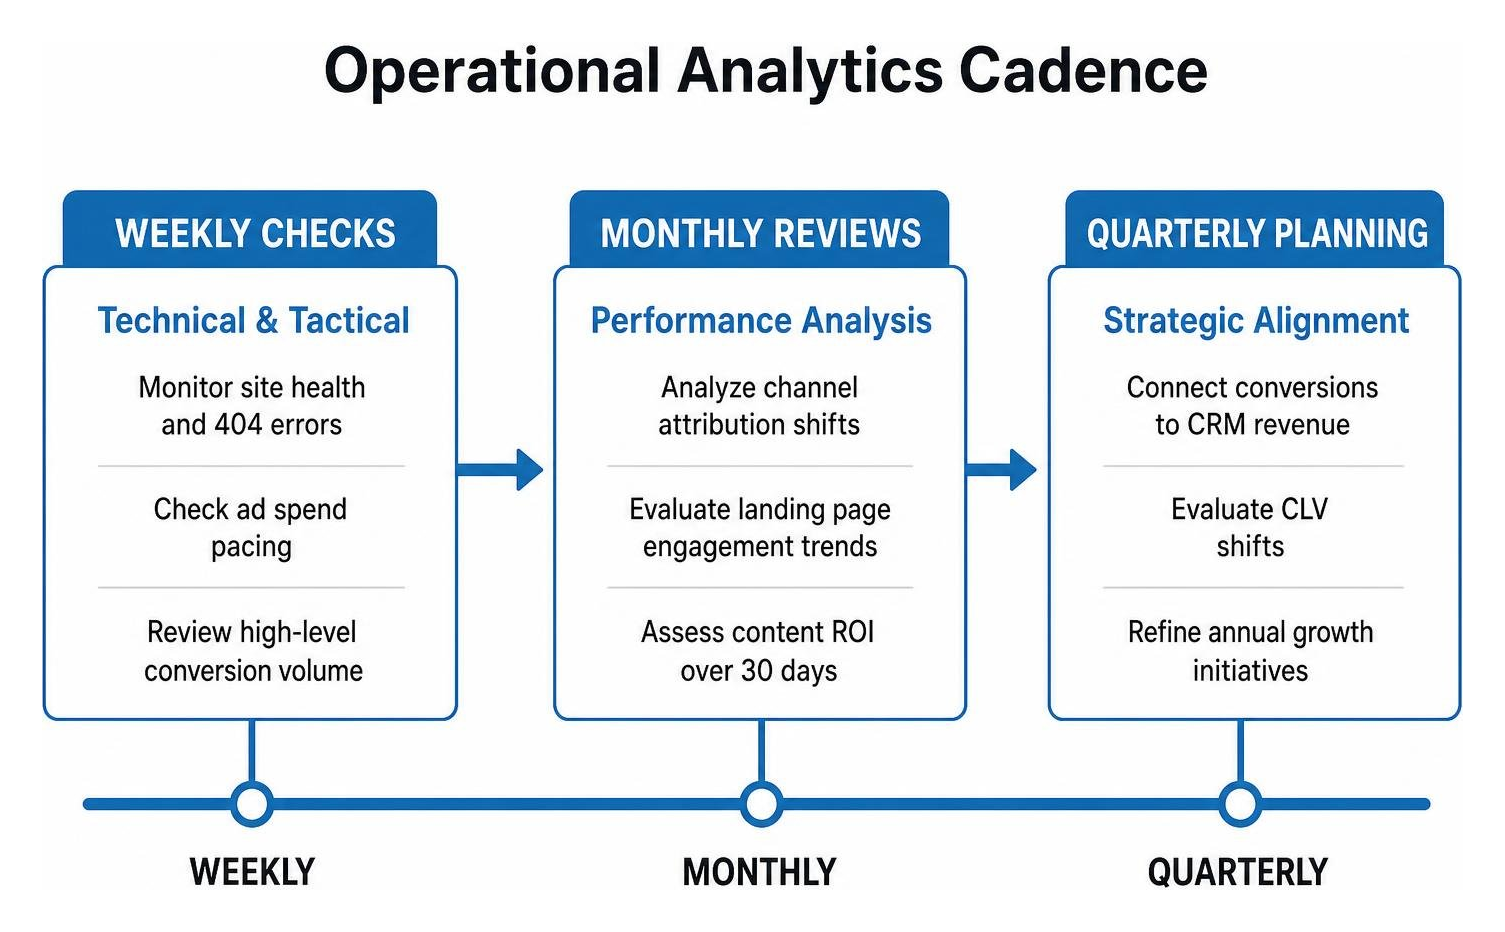
- Weekly Checks: Monitor technical site health, 404 error spikes, ad campaign spend pacing, and high-level conversion volume.
- Monthly Reviews: Analyze channel attribution shifts, landing page engagement trends, and content ROI over a 30-day window.
- Quarterly Planning: Connect website conversions directly to CRM revenue data, evaluate CLV shifts, and refine annual growth initiatives.
To structure your ongoing evaluation processes, follow our step-by-step guide to analyze digital marketing alongside our ultimate checklist for website analytics.
Frequently Asked Questions About Key Website Analytics Metrics
What is the difference between Bounce Rate and Engagement Rate in GA4?
Bounce Rate in legacy analytics measured visits that included only one pageview, regardless of time spent. GA4 defines Engagement Rate as the percentage of sessions lasting 10+ seconds, triggering a key conversion event, or viewing two or more pages. In GA4, Bounce Rate is simply the mathematical inverse of Engagement Rate (100% minus Engagement Rate).
How often should small business owners review their website metrics?
Small business owners should conduct a strategic review once per month. Reviewing data daily or weekly often highlights statistical noise rather than true behavioral trends. A monthly cadence provides sufficient data volume (typically 30 days of interactions) to make confident marketing decisions.
Which technical website metrics impact SEO rankings and conversions most?
Page load speed and Core Web Vitals (specifically Largest Contentful Paint, Cumulative Layout Shift, and Interaction to Next Paint) exert the greatest impact. Search engines favor fast, stable, and mobile-responsive pages, while visitors abandon slow sites before converting.
Conclusion: Transforming Raw Data into a Scalable Growth Engine
Website analytics should clarify your path forward, not complicate it. By tracking a focused set of key website analytics metrics—active users, engagement rate, key event rates, traffic sources, landing pages, exit pages, load speed, and marketing ROI—you move away from vanity metrics toward sustainable growth.
At Marketing Magnitude, we believe sustainable business growth happens when marketing, CRM technology, automation, analytics, and operations work together as one connected system. Discover how our website marketing analytics solutions help service-based businesses turn analytics data into predictable revenue and long-term success.
Get Started Now
Fill out this form to start your journey to next-level marketing solutions for your business.