
Why Website Analytics Is the Foundation of Smart Business Growth
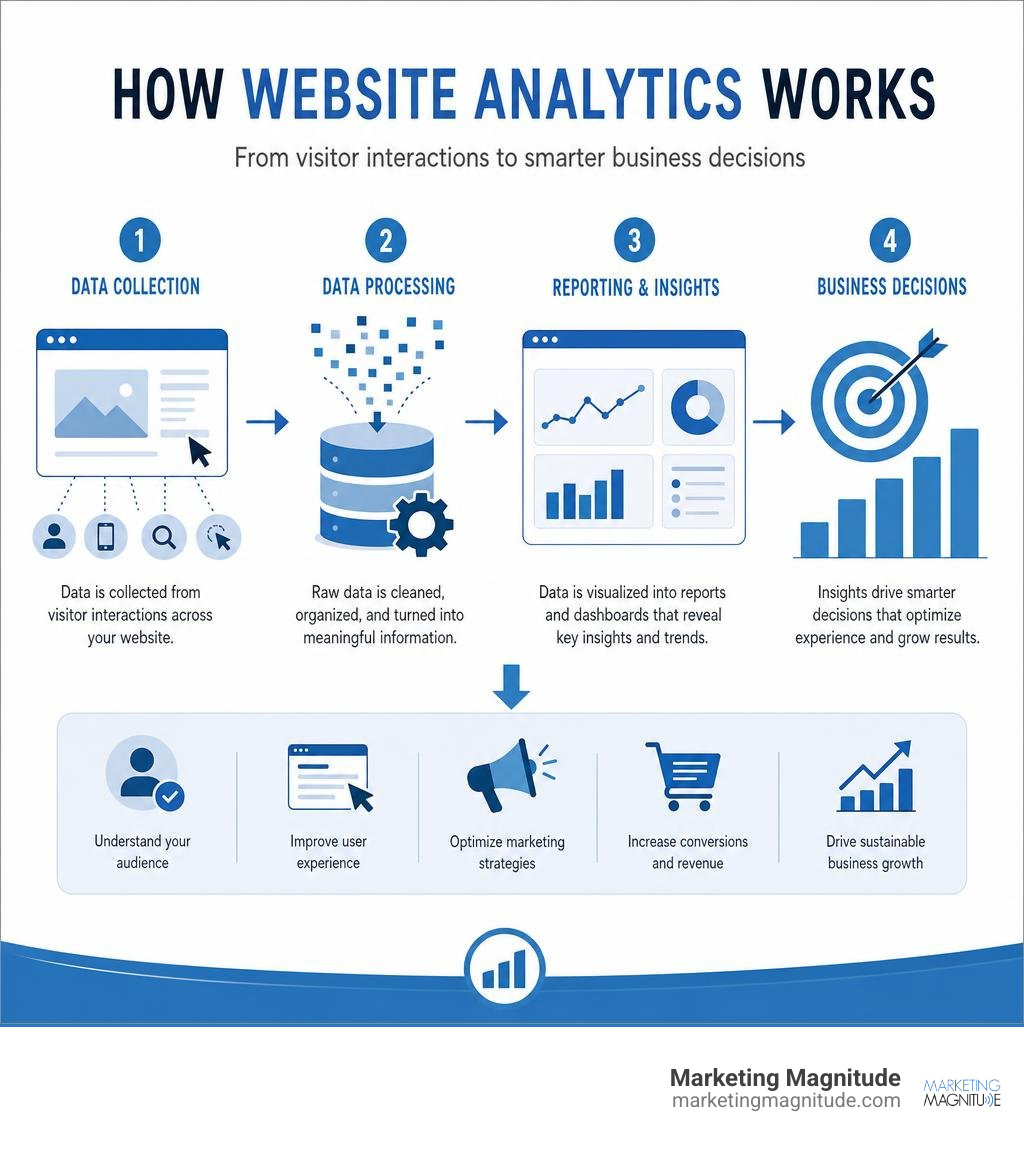
Website analytics is the process of collecting, measuring, and interpreting data about how visitors find and use your website — so you can make smarter decisions about your marketing, content, and user experience.
Here’s what website analytics tells you at a glance:
| What You Can Measure | Why It Matters |
|---|---|
| How many people visit your site | Measures reach and brand awareness |
| Where your traffic comes from | Shows which marketing channels work |
| What pages visitors view | Reveals your most valuable content |
| How long visitors stay | Indicates engagement quality |
| How many visitors convert | Tracks ROI from marketing spend |
| Where visitors drop off | Uncovers friction in the customer journey |
Most business owners know their website matters. But without analytics, you’re essentially guessing — spending money on ads, SEO, and content without knowing what’s actually working.
The stakes are real. Analytics tools that rely on cookie consent can miss 20–60% of your actual visitors, meaning many businesses are making decisions based on incomplete data. And businesses that do use analytics effectively see dramatic results — one retailer achieved an 18x improvement in conversion rate after using analytics to understand and re-engage their audience.
The good news? You don’t need to be a data scientist. You just need the right tools, the right setup, and a clear checklist to follow.
I’m Kelly Rossi, founder of Marketing Magnitude and a digital marketing professional with over 20 years of experience helping businesses turn website analytics into measurable growth. This guide gives you a practical, no-fluff checklist to set up, interpret, and act on your analytics data — whether you’re just getting started or cleaning up an existing setup.
What is Website Analytics and Why Does It Matter?
At its core, website analytics is about understanding user behavior. It transforms anonymous clicks into actionable, strategic insights. When you understand how visitors navigate your pages, you can optimize their experience, eliminate technical friction, and dramatically improve your marketing ROI.
Without these insights, your digital presence is a black box. You might notice a drop in sales or an increase in inquiries, but you won’t know why it happened. Was it a broken contact form? Did a new competitor launch a campaign? Or did a recent algorithm change impact your organic search rankings?
For service-based businesses in trust-centric industries—such as healthcare providers, wellness brands, and professional services in Austin, TX or Las Vegas, NV—knowing how users interact with your educational content and scheduling tools is paramount. To dive deeper into the strategic side of these metrics, read our comprehensive Guide to Online Marketing Analysis.
Key Metrics to Track in Your Website Analytics Dashboard
To keep your finger on the pulse of your digital growth, you must look beyond basic vanity metrics like raw pageviews. Instead, focus on actionable indicators that reflect genuine interest, engagement, and intent.
- Traffic Volume & Sources: This measures how many unique users visit your site and where they originate (organic search, paid ads, social media, or direct traffic).
- Engagement Rate: Replacing the outdated bounce rate in modern platforms like GA4, engagement rate measures the percentage of sessions that lasted longer than 10 seconds, had a conversion event, or viewed two or more pages.
- Average Engagement Time: How long do real people actually spend consuming your content? This reveals whether your messaging aligns with user search intent.
- Conversion Rate: The percentage of visitors who complete a desired action, such as filling out a contact form, calling your local office, or booking an appointment.
- Bounce Rate: While less emphasized in GA4, tracking sudden spikes in immediate exits remains useful for identifying broken pages or highly irrelevant landing page traffic.
For a streamlined approach to monitoring your performance, discover the 5 Key Metrics Every Business Owner Should Check Weekly to keep your growth on track without getting overwhelmed by data overload.
Traditional Web Analytics vs. Digital Experience Intelligence (DXI)
Traditional web analytics tools are excellent at telling you what is happening on your website. They provide the quantitative data: how many people visited, which pages they clicked, and where they dropped off. However, they fall short of explaining the why behind visitor actions.
This is where Digital Experience Intelligence (DXI) platforms step in. DXI bridges the gap between quantitative numbers and qualitative user behavior by integrating advanced visualization tools:
- Session Replay: Watch real, anonymous user sessions to see exactly how visitors navigate your layouts, where they pause, and where they encounter “rage clicks” (repeatedly clicking an unclickable element).
- Heatmaps: Visualize where users click, scroll, and move their cursors most frequently on a page, showing you which sections capture attention and which are ignored.
- Friction Identification: Automatically flag javascript errors, slow-loading elements, or complex forms that prevent users from converting.
By combining traditional metrics with behavioral insights, you gain a complete, 360-degree view of the customer journey. To explore how behavioral data connects campaign performance directly to product and site interaction, check out the Web Analytics Platform by Amplitude.
Comparing the Top Analytics Tools in 2026
The analytics landscape in July 2026 offers diverse solutions tailored to different business priorities, technical requirements, and privacy compliance standards. Let’s compare the leading platforms to help you identify the best fit for your organization.
| Platform | Best For | Core Strengths | Privacy Level | Tracker Size |
|---|---|---|---|---|
| Google Analytics 4 | Enterprise & Cross-Platform | Machine learning insights, robust ad integrations, cross-device tracking | Requires consent banner | ~135 KB |
| Plausible Analytics | Small-to-Mid Businesses | Lightweight script, fast site speed, clean dashboard, 100% GDPR compliant | High (No cookies needed) | ~2.5 KB |
| Simple Analytics | Privacy-First Brands | Captures 100% of traffic without consent banners, zero personal data tracking | High (No cookies needed) | ~3.0 KB |
| Clycyo Analytics | Developers & Product Teams | Integrates pageviews, Web Vitals, JS errors, and revenue in one timeline | High (No cookies needed) | 1.1 KB |
| Cloudflare Web Analytics | Security & Speed Focused | Non-invasive, runs at network edge or via lightweight beacon, completely free | High (No cookies needed) | Ultra-lightweight |
Enterprise and Standard Platforms
For businesses that require deep data segmentation, cross-platform attribution, and seamless integration with advertising channels, enterprise-grade tools remain the industry standard.
The premier free option is Google’s flagship platform. By using the Analytics Tools & Solutions for Your Business – Google Analytics, organizations can leverage advanced machine learning models to predict customer churn, calculate lifetime value, and automate behavioral reporting.
These enterprise systems excel at cross-platform tracking, allowing you to connect user paths across mobile applications and desktop sites. For example, McDonald’s Hong Kong utilized Google Analytics 4 to increase their in-app orders by 550%, while other organizations have cut manual reporting time by 50% by unifying their web and app data.
To ensure your tracking translates directly into commercial success, consult our guide on Marketing Metrics 101: Know If It’s Working.
Privacy-First and Lightweight Alternatives
As global privacy regulations tighten and consumers reject tracking cookies, privacy-first and lightweight alternatives have experienced a massive surge in adoption.
Traditional analytics scripts are heavy. Loading them on every page view can slow down your site, hurting both user experience and technical SEO. For instance, the Plausible Analytics | Simple, privacy-friendly Google Analytics alternative script is 54 times smaller than Google’s tracker. By downloading 135KB less JavaScript per visitor, a site with 100,000 monthly visits can save approximately 4 kg of CO2 emissions per year simply by switching.
Furthermore, traditional tools often miss up to 60% of actual traffic due to users declining cookie consent banners. Platforms like Simple Analytics solve this “consent data gap” by collecting non-identifiable, aggregate data without cookies, capturing 100% of your traffic while remaining fully compliant with GDPR, CCPA, and PECR.
For developers and engineering teams, Privacy-first web analytics for developers · Clycyo offers a 1.1 KB tracker that joins pageviews, page-load times, click heatmaps, and Web Vitals on a single visitor timeline. If you are looking for a completely free, non-invasive option that runs at the network edge without client-side storage, Cloudflare Web Analytics | Cloudflare is an outstanding solution trusted by millions of web properties.
Step-by-Step Implementation Checklist
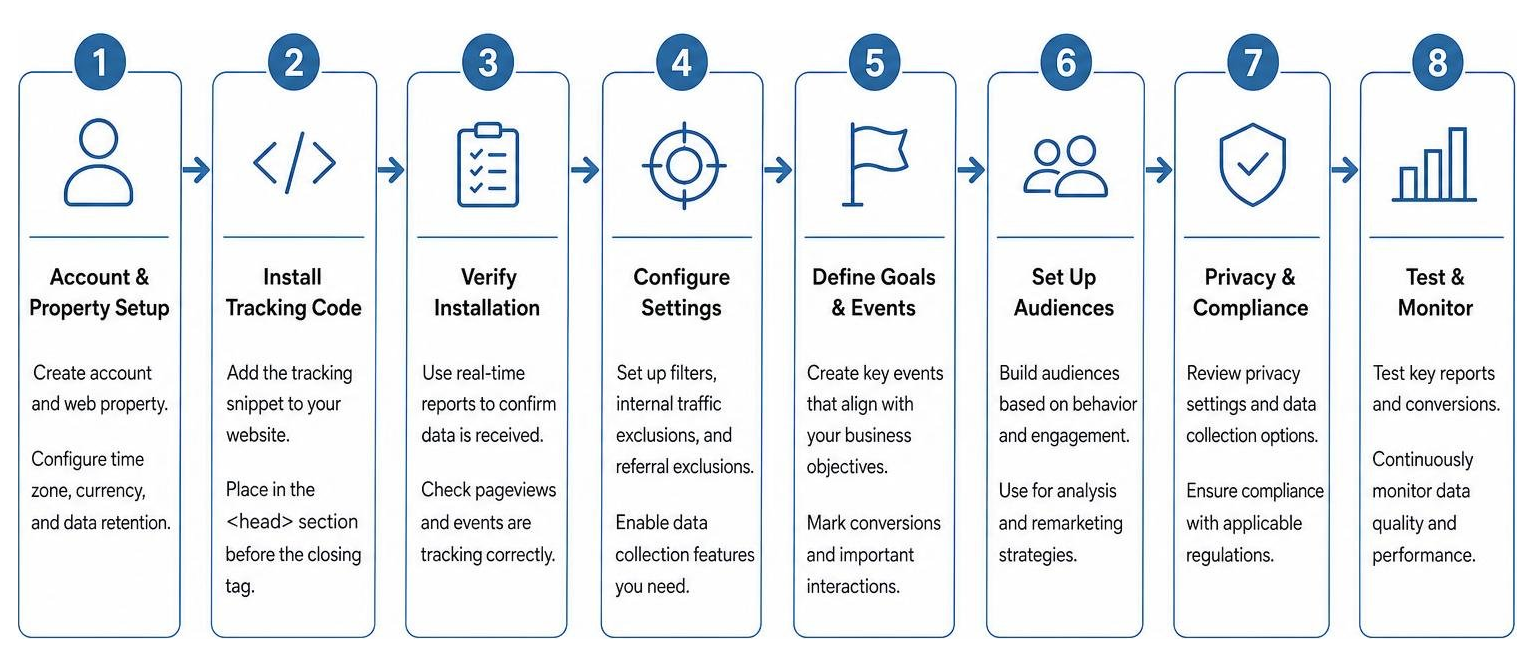
Setting up your chosen platform correctly is vital to ensure you are collecting clean, reliable data from day one. Follow this structured roadmap to get started.
1. Account and Property Setup
- Create your master account and establish a new web property.
- Configure your reporting time zone and currency. If you manage multiple locations across Nevada and Texas, ensure your primary time zone is set consistently to avoid reporting spikes during Daylight Savings transitions.
- Set your data retention window (in GA4, extend the default 2-month retention to 14 months to enable year-over-year reporting).
2. Data Stream Configuration
- Add a new data stream for your website.
- Enable automatic tracking features (such as Enhanced Measurement in GA4) to capture scrolls, outbound clicks, site search, and video engagement without custom code.
3. Script Installation
- Locate your tracking tag ID or container code.
- Insert the lightweight script into the
of your website. If you use a content management system (CMS) like WordPress, Shopify, or Webflow, look for a native integration field where you can simply paste your measurement ID. - For detailed, official platform documentation on this process, refer to the guide to Set up Analytics for a website and/or app – Analytics Help.
4. Verification
- Open your website in an incognito window.
- Check the “Realtime” report in your analytics dashboard to verify that your active session is being recorded. This verification process typically takes less than 30 seconds to confirm.
Setting Up Conversion and Event Tracking
Once your basic pageview tracking is live, you must configure event tracking to measure valuable business outcomes. A conversion occurs when a visitor takes an action that directly contributes to your bottom line.
- Custom Event Creation: Define specific parameters for actions like clicking a “Call Now” button, downloading a PDF brochure, or submitting a contact form.
- Funnel Definition: Group sequential events together to map out your checkout or sign-up flow. This lets you pinpoint exactly where users abandon the process.
- Attribution Configuration: Set up rules to determine which marketing touchpoints get credit for a conversion (e.g., first-click, last-click, or data-driven attribution).
To ensure your tracking is capture-ready and aligned with your business goals, read our specialized resource on Website Conversion Tracking.
Overcoming Data Gaps and Consent Limitations
With privacy regulations like GDPR and CCPA requiring explicit consent before tracking personal data, cookie banners have become a major source of data loss. When visitors click “Reject All,” traditional tracking scripts block data collection entirely, creating huge blind spots in your marketing reports.
To overcome these limitations and regain visibility into your actual traffic:
- Adopt a Hybrid Analytics Model: Run a standard platform (like GA4) alongside a privacy-first, cookie-free tool (like Simple Analytics or Plausible). Use the privacy tool to capture 100% of raw traffic volume and referrers, and use the standard platform for deep behavioral analysis of consenting users.
- Implement Server-Side Tracking: Move your tracking tags from the client’s browser to a secure cloud server. This prevents ad blockers from breaking your tracking scripts and improves your site’s loading speed.
- Use First-Touch UTM Preservation: Store campaign source parameters (UTMs) in server-side sessions to preserve accurate referral attribution even when users navigate across multiple sessions.
How to Leverage Data for Business Optimization
Collecting data is only half the battle; the real magic happens when you turn those numbers into actionable business decisions.

- SEO Improvement: Analyze which landing pages attract the most organic traffic. Look for pages with high search impressions but low click-through rates (using Google Search Console integrations) to optimize your meta titles and descriptions. Identify pages with high traffic but low engagement to rewrite and improve the content quality.
- Marketing ROI Optimization: Compare conversion rates across different traffic channels. If your paid search ads are driving high-quality leads at a lower cost-per-acquisition (CPA) than social media ads, shift your budget accordingly. For instance, Lider consolidated their measurement sources to re-engage high-intent users, resulting in an 85% decrease in CPA and an 18x conversion rate improvement.
- User Experience (UX) Refining: Use behavior flow reports to identify high-friction drop-off points. If 70% of users leave your booking page without completing the form, simplify the fields, remove unnecessary steps, or add trust signals (such as security badges and client testimonials) to reassure them.
To understand how your digital optimization efforts translate into tangible financial assets, learn how to Find Out the Value of Your Website.
How to Choose the Right Website Analytics Platform
Selecting the perfect analytics stack depends on your unique business model, technical capabilities, and operational goals. Use this checklist to guide your decision:
- Identify Your Core Business Needs: Do you need to track complex multi-step user journeys across web and mobile apps (favoring Amplitude or GA4)? Or do you simply need to monitor daily traffic, top referrers, and conversion rates (favoring Plausible or Simple Analytics)?
- Evaluate Integration Capabilities: Ensure your selected tool integrates seamlessly with your existing technology stack, including your CRM, email marketing platforms, and advertising accounts.
- Consider Reporting Automation: If you run an agency or manage multiple locations, look for reporting tools that automate client-facing dashboards. For example, Swydo supports over 32 integrations, helping agencies save 8 to 16 hours on manual reporting while boosting overall team productivity by 30%.
- Assess Budget Scalability: Look for transparent pricing plans that scale with your traffic growth without locking you into expensive enterprise tiers prematurely.
Frequently Asked Questions about Web Analytics
Why is my traffic data showing discrepancies between platforms?
Traffic discrepancies are incredibly common and usually occur because different platforms use different tracking methodologies. For example, Google Analytics relies on cookie consent and client-side JavaScript, which can be blocked by ad blockers or rejected by users on cookie banners.
Conversely, privacy-first tools or server-side logs capture raw network requests, resulting in higher, more accurate overall traffic counts. Discrepancies also arise from differing definitions of a “session” or how platforms filter out non-human bot traffic.
Do I need a cookie consent banner for all tracking tools?
No. You only need a cookie consent banner if your tracking tools store or access cookies, device identifiers, or personal data on the visitor’s device.
If you use privacy-first, cookie-free analytics tools like Plausible, Simple Analytics, Clycyo, or Cloudflare Web Analytics, no personal data is tracked or stored. This means you can legally run these tools without annoying cookie consent banners under GDPR and CCPA.
How long does it take for tracking tools to start collecting data?
Once your tracking script is installed and verified, data collection begins immediately. Most modern analytics platforms feature a “Realtime” or “Live” report where you can see active visitors on your site within seconds.
However, standard aggregate reports, audience segmentations, and historical dashboards typically take anywhere from 3 to 24 hours to process and display fully in your main reporting dashboard.
Conclusion
In July 2026, website analytics is no longer just about counting hits; it is about building a connected growth ecosystem. When your marketing, communication, and analytics work together as one unified system, your business growth becomes predictable, sustainable, and scalable.
At Marketing Magnitude, we specialize in helping service-based businesses—especially those in trust-centered industries like healthcare, wellness, and professional services—turn complex data into clear, actionable growth strategies. We design custom digital infrastructures that connect your website, CRM, automated workflows, and reporting tools into a single source of truth.
Ready to eliminate the guesswork and start growing your business with absolute clarity? Explore our specialized Website Marketing Analytics services, or reach out to our team today to build a sustainable, data-driven growth engine for your brand.